Groww Nifty 1D Rate Liquid ETF
Invest Now
Fund Manager: |
ETFs |
NIFTY 1D Rate Index
NAV as on 08-01-2026
AUM as on
Rtn ( Since Inception )
5.6%
Inception Date
Sep 20, 2024
Expense Ratio
0.29%
Fund Status
Open Ended Scheme
Min. Investment
0
Min. Topup
0
Min. SIP Amount
0
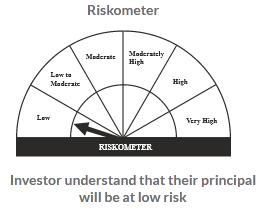
Risk Status
low
Investment Objective :
Fund Performance
3 and 6 Months returns are absolute
NAV Movement
Returns (%)
| 3 Mon | 6 Mon | 1 Yr | 3 Yrs | 5 Yrs | 10 Yrs | |
|---|---|---|---|---|---|---|
| Fund | 1.22 | 2.49 | 5.34 | 0.0 | 0.0 | 0.0 |
| Nifty 1D Rate Index | 1.34 | 2.72 | 5.78 | 6.42 | 5.48 | 5.51 |
| ETFs | 6.92 | 12.48 | 22.66 | 19.87 | 15.36 | 14.83 |
| Rank within Category | ||||||
| Number of Funds within Category |
Peer Comparison
| Return (%) | ||||||
|---|---|---|---|---|---|---|
| Scheme Name | AUM (crore) |
Expense Ratio |
1 Yr | 3 Yrs | 5 Yrs | 10 Yrs |
| Groww Nifty 1D Rate Liquid ETF | 11.7 | 0.29 | 5.34 | 0.0 | 0.0 | 0.0 |
| Tata Silver Exchange Traded Fund | 138.29 | 0.44 | 160.77 | 0.0 | 0.0 | 0.0 |
| HDFC Silver ETF - Growth Option | 375.72 | 0.45 | 158.21 | 47.78 | 0.0 | 0.0 |
| ICICI Prudential Silver ETF | 1,073.9 | 0.4 | 158.04 | 48.04 | 0.0 | 0.0 |
| DSP Silver ETF | 154.89 | 0.4 | 157.77 | 48.27 | 0.0 | 0.0 |
| Aditya Birla Sun Life Silver ETF | 200.48 | 0.35 | 157.69 | 48.17 | 0.0 | 0.0 |
| Kotak Silver ETF | 262.95 | 0.45 | 157.51 | 48.39 | 0.0 | 0.0 |
| Axis Silver ETF | 91.33 | 0.37 | 157.2 | 48.34 | 0.0 | 0.0 |
| Mirae Asset Silver ETF | 56.14 | 0.34 | 157.19 | 0.0 | 0.0 | 0.0 |
| SBI Silver ETF | 277.11 | 0.4 | 156.87 | 0.0 | 0.0 | 0.0 |
Yearly Performance (%)
Historical Returns (%)
| 2010 | 2011 | 2012 | 2013 | 2014 | 2015 | 2016 | 2017 | 2018 | 2019 | |
|---|---|---|---|---|---|---|---|---|---|---|
| Fund | 0.0 | 0.0 | 0.0 | 0.0 | 0.0 | 0.0 | 0.0 | 0.0 | 0.0 | 0.1 |
| NIFTY 1D Rate Index | 3.28 | 4.76 | 6.74 | 6.79 |
Returns Calculator
Growth of 10000 In SIP (Fund vs Benchmark)
Growth of 10000 In LUMPSUM (Fund vs Benchmark)
Rolling Returns
Rolling returns are the annualized returns of the scheme taken for a specified period (rolling returns period) on every day/week/month and taken till the last day of the duration. In this chart we are showing the annualized returns over the rolling returns period on every day from the start date and comparing it with the benchmark. Rolling returns is the best measure of a fund's performance. Trailing returns have a recency bias and point to point returns are specific to the period in consideration. Rolling returns, on the other hand, measures the fund's absolute and relative performance across all timescales, without bias.
Fund Multiplier
Riskometer

Asset Allocation
Top 10 Holdings
| Company | Instrument | Credit Rating | Holdings (%) |
|---|
Related Funds in this Category
Sector Allocation (%)
Equity Holdings
| Sector | Allocation (%) |
|---|
Market Cap Distribution
Portfolio Behavior
| Volatility | - |
| Sharp Ratio | - |
| Alpha | - |
| Beta | - |
| Standard Deviation | - |
| Portfolio Turnover |
Extreme Performance
| Time Frame | Period | Fund (%) |
Benchmark (%) |
|---|---|---|---|
| Best Month | 30-05-2014 | 11.64 | 8.11 |
| Worst Month | 31-01-2011 | -10.46 | -10.23 |
| Best Quarter | 30-06-2014 | 20.12 | 14.03 |
| Worst Quarter | 30-09-2011 | -9.40 | -12.11 |
| Best Year | 31-12-2014 | 57.64 | 32.91 |
| Worst Year | 30-12-2011 | -22.29 | -23.81 |